还是熟悉的数据,这回来做一个柱状图
[数据下载地址]
准备工作
还是熟悉的数据载入
1
2
| const pathToJSON = "./data/nyc_weather_data.json"
const dataset = await d3.json(pathToJSON)
|
接着设置参数
1
2
3
4
5
6
7
8
9
10
11
12
13
14
15
16
17
| const width = 600
let dimensions = {
width: width,
height: width * 0.9,
margin: {
top: 30,
right: 10,
bottom: 50,
left: 50,
},
}
dimensions.boundedWidth = dimensions.width
- dimensions.margin.left
- dimensions.margin.right
dimensions.boundedHeight = dimensions.height
- dimensions.margin.top
- dimensions.margin.bottom
|
处理画布和bound
1
2
3
4
5
6
7
8
9
10
11
12
13
14
15
| const wrapper = d3
.select('#wrapper')
.append('svg')
.attr('width', dimensions.width)
.attr('height', dimensions.height)
const bounds = wrapper
.append('g')
.style(
'transform',
`translate(${
dimensions.margin.left
}px, ${
dimensions.margin.top
})`
)
|
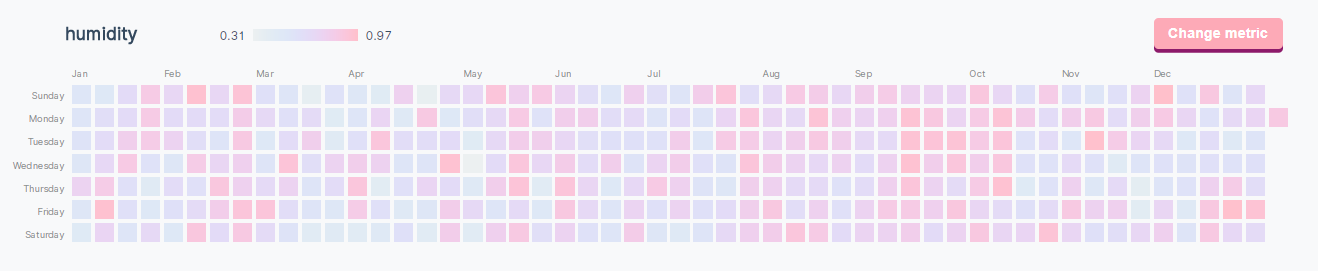
准备先用柱状图对湿度humidity进行一个统计
1
| const metricAccessor = d => d.humidity
|
然后根据湿度的范围创建一个比例尺
1
2
3
4
5
| const xScale = d3
.scaleLinear()
.domain(d3.extent(dataset, metricAccessor))
.range([0, dimensions.boundedWidth])
.nice()
|
数据分组
然后我们需要对数据进行分组,决定他们都是属于哪个bin的
这里采用histogram方法,首先需要通过domain传入域,然后通过value告诉生成器获取值的方法,因为dataset是对象集,我们要获得对应的湿度值,thresholds可以告诉生成器我们希望它生成几个bin,当然不一定完全听你的,但是生成器会尽可能接近设定的组数
1
2
3
4
| const binsGenerator = d3.histogram()
.domain(xScale.domain())
.value(metricAccessor)
.thresholds(12)
|
分组并查看
1
2
| const bins = binsGenerator(dataset)
console.log(bins)
|
可以看到一共分出了15组

然后我们就可以根据我们的bin来创建y比例尺了
1
2
3
4
5
| const yAccessor = d => d.length
const yScale = d3.scaleLinear()
.domain([0, d3.max(bins, yAccessor)])
.range([dimensions.boundedHeight, 0])
.nice()
|
分组之后的x0和x1表示组内湿度的下限和上限,length表示组内的元素数量
绘制数据
首先生成一个组来画柱子
1
2
3
4
| const binsGroup = bounds.append("g")
const binGroups = binsGroup.selectAll("g")
.data(bins)
.enter().append("g")
|
绘制柱子,注意提到过的svg的y轴是从上到下的
1
2
3
4
5
6
7
| const barPadding = 1
const barRects = binGroups.append("rect")
.attr("x", d => xScale(d.x0) + barPadding / 2)
.attr("y", d => yScale(yAccessor(d)))
.attr("width", d => d3.max([0, xScale(d.x1) - xScale(d.x0) - barPadding]))
.attr("height", d => dimensions.boundedHeight - yScale(yAccessor(d)))
.attr("fill", "cornflowerblue")
|
成功绘制了柱子
然后我们在柱子上方写上对应的数据
1
2
3
4
5
6
7
8
9
| const barText = binGroups.filter(yAccessor)
.append("text")
.attr("x", d => xScale(d.x0) + (xScale(d.x1) - xScale(d.x0)) / 2)
.attr("y", d => yScale(yAccessor(d)) - 5)
.text(yAccessor)
.style("text-anchor", "middle")
.attr("fill", "darkgrey")
.style("font-size", "12px")
.style("font-family", "sans-serif")
|
.filter()的参数为一个接受一个数据点并返回一个值的函数,数据集中任何返回错误值的项都将被删除
效果如下
接着我们可以在图像上标注一根代表平均值的线
1
2
3
4
5
6
7
8
| const mean = d3.mean(dataset, metricAccessor)
const meanLine = bounds.append("line")
.attr("x1", xScale(mean))
.attr("x2", xScale(mean))
.attr("y1", -15)
.attr("y2", dimensions.boundedHeight)
.attr("stroke", "maroon")
.attr("stroke-dasharray", "2px 4px")
|
再加个字儿
1
2
3
4
5
6
7
8
| const meanLabel = bounds
.append('text')
.attr('x', xScale(mean))
.attr('y', 15)
.text('mean')
.attr('fill', 'maroon')
.style('font-size', '12px')
.style('text-anchor', 'middle')
|
补一手x轴和标注
1
2
3
4
5
6
7
8
9
10
11
12
13
| const xAxisGenerator = d3.axisBottom()
.scale(xScale)
const xAxis = bounds.append("g")
.call(xAxisGenerator)
.style("transform", `translateY(${dimensions.boundedHeight}px)`)
const xAxisLabel = xAxis.append("text")
.attr("x", dimensions.boundedWidth / 2)
.attr("y", dimensions.margin.bottom - 10)
.attr("fill", "black")
.style("font-size", "1.4em")
.text(metricAccessor)
.style("text-transform", "capitalize")
|
代码模板化
说到代码模板化,其实我们前边一直在做这件事情,用metricAccessor来表示我们要计算的湿度,我们只要将其它的属性作为metricAccessor传递进去就能创建对应的图表了
1
2
3
4
| const drawHistogram = metric => {
const metricAccessor = d => d[metric]
}
|
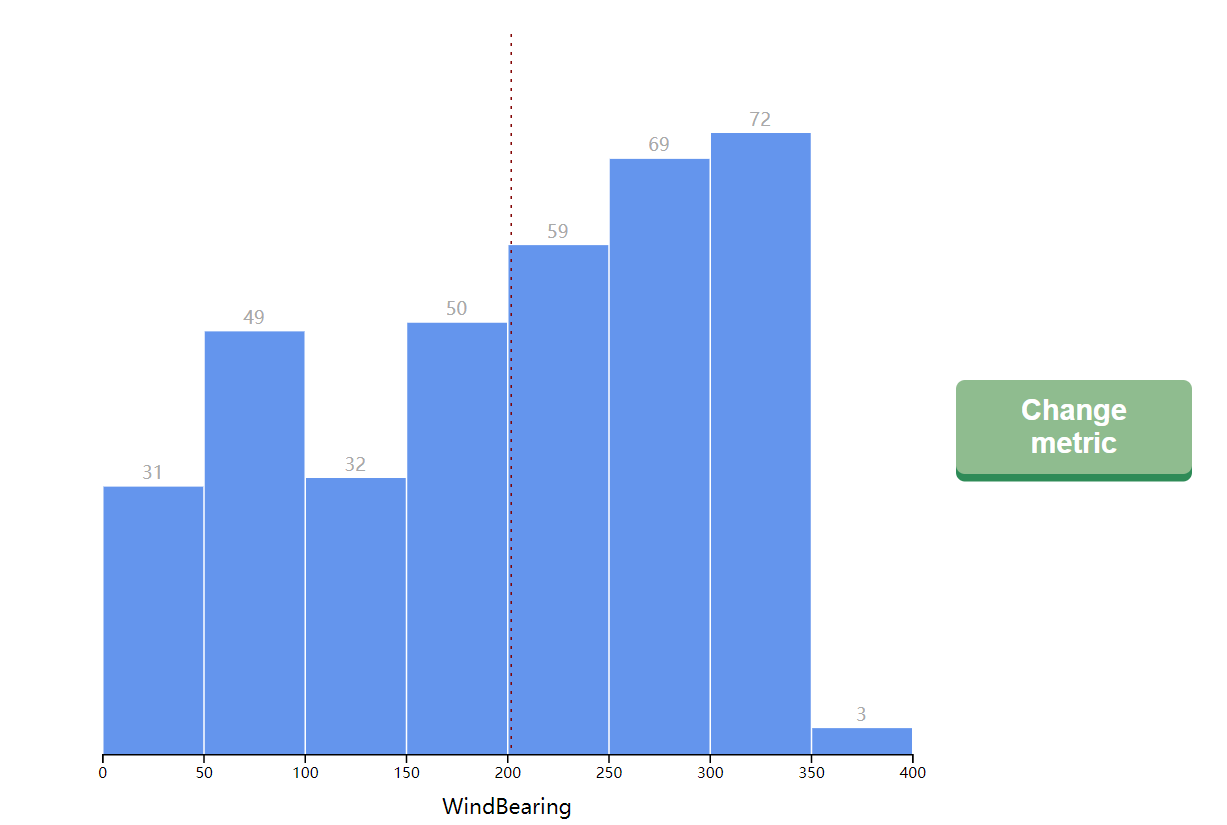
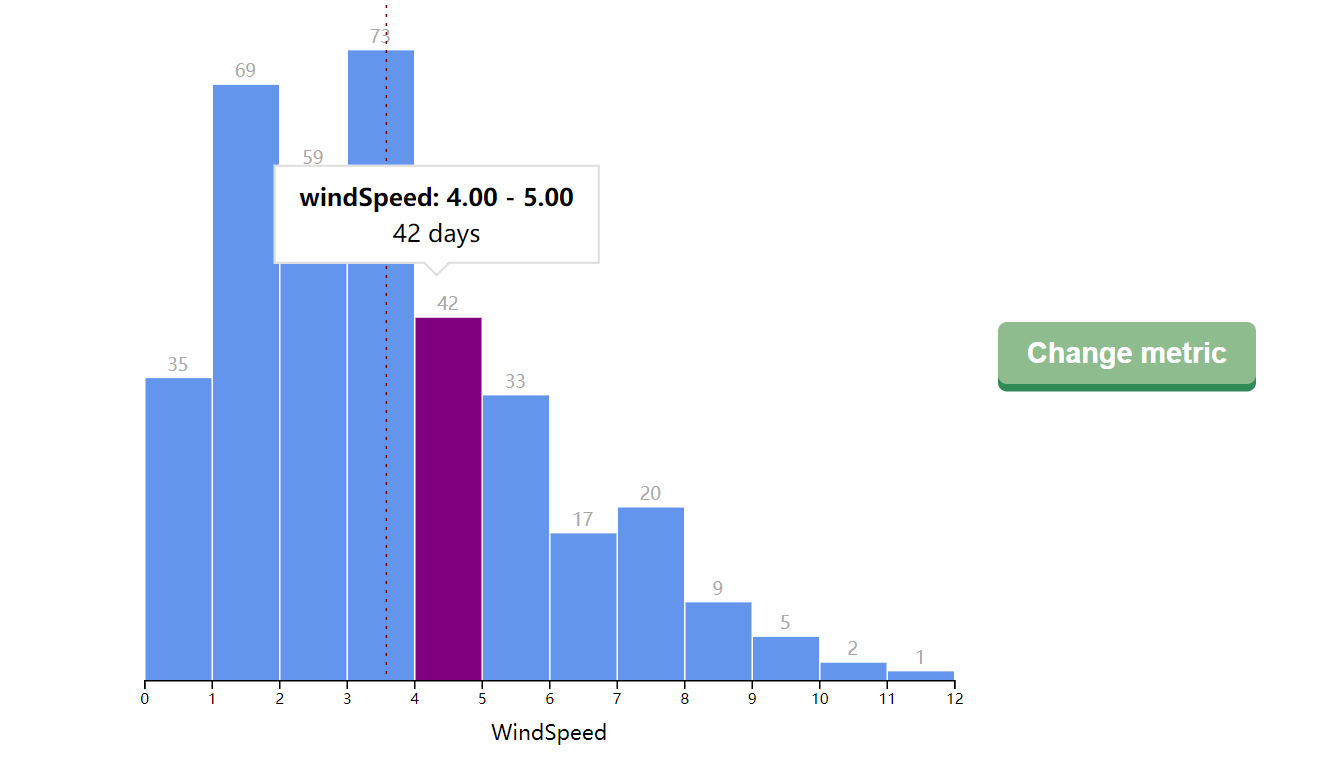
最后用一个循环对于每种属性去调用这个函数,就能够画出对应属性的图表
1
2
3
4
5
6
7
8
9
10
11
| const metrics = [
"windSpeed",
"moonPhase",
"dewPoint",
"humidity",
"uvIndex",
"windBearing",
"temperatureMin",
"temperatureMax",
]
metrics.forEach(drawHistogram)
|
[演示地址]